This is Love and Marriage in America Today
The institution of marriage predates recorded history and has changed much throughout its history. The love, sex, monogamy, and attraction components were not as much a part of marriage until much later. Starting as a way to strengthen family social and business bonds to slowly integrating the familiar attributes we associate with marriage today, the ‘I dos’ are changing over to ‘maybe we will’ or ‘maybe we won’t’.
Why do People Marry?
Love is the top reason to marry, according to a 2013 survey by Pew Research. With 88% of the survey responders saying love was the reason they wanted to get married, then making a lifelong commitment (81%), companionship (76%). Having their relationship recognized in a religious ceremony was far down on the list (30%), financial stability (28%) and less than a quarter percentage (23%) cited legal rights and benefits as a reason for getting married.
A 2017 Pew Research survey found that being a good financial provider was deemed important for men to be a good husband or partner (71%), while only 32% said the same thing for a woman to be a good wife or partner.
What helps people stay married? A 2015 survey said having shared interests (64%), a good sexual relationship (61%) and when a husband or wife helps share the household chores (56%).
Who’s Married?
Forty-Eight percent of Americans age fifteen plus were married in 2017. The age group with the lowest percentage of married members is ages 20-34 (Millennials – 27.1%) and the age group that said ‘I do’ the most were 55-64-year-olds (67.3%). In 2017, the marriage breakdown by race is as follows: Blacks married at 29.3%, Whites, 52.7%, Native Americans, 36.7%, Native Hawaiian and other Pacific Islanders, 45.4% and Asians were married at the highest percentage at 58.2%.
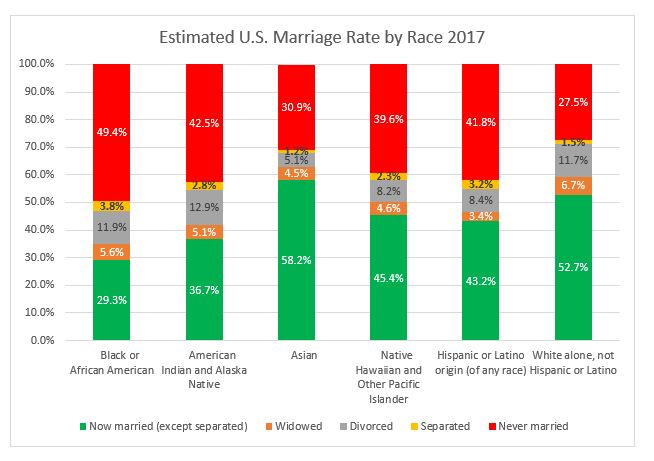
Data from U.S. Census Bureau
Men were married at 58% (73.573M) compared to 69.899M women married (52.5%). Four percent more men have never married than women (25.5% vs 21.5%).
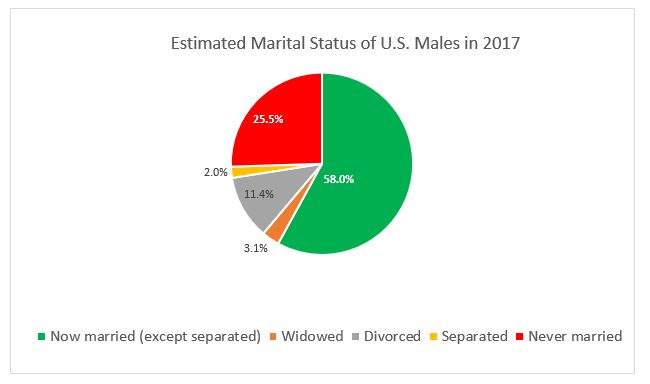
Data from U.S. Census Bureau
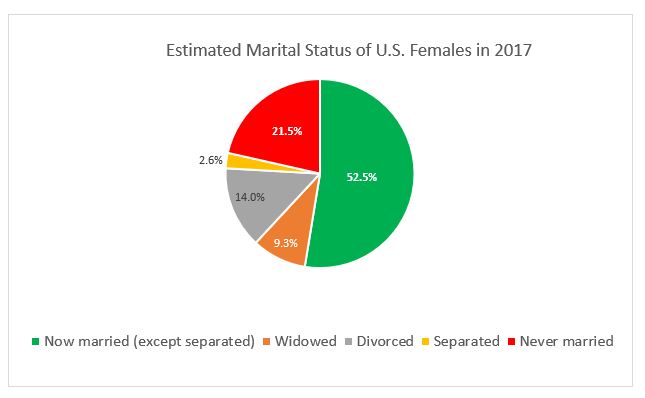
Data from U.S. Census Bureau
Marriage Evolves
According to a Pew Research Center analysis, interracial marriage is on the rise. In 2015 17% of newlyweds chose someone from a different race or ethnicity. This is up nearly six times from 1967 when just 3% of newlyweds did the same.
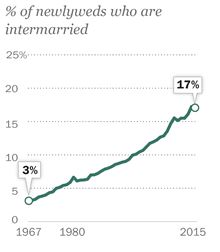
Source: Pew Research Center
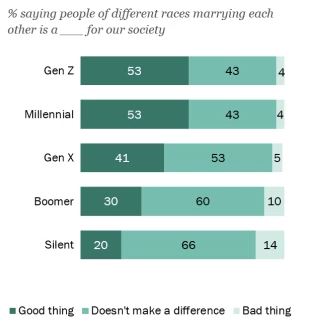
Asian and Hispanic newlyweds are most likely to intermarry (a respective 29% and 27%) in the U.S., but the biggest increase in the number of newlyweds intermarrying was among blacks. In 1980, only 5% of black newlyweds married someone of a different race or ethnicity. In 2015, more than three times as many blacks (18%) intermarried. According to a 2019 Pew Center report, the generations had widely differing opinions about whether intermarrying was good for society. Among Gen Z and Millennials, 53% say intermarrying was good, and 41% of Gen Xers said so. As generation members got older, they opined that intermarrying was not good for society: Boomers (30%) and the Silent Generation (20%).
Source: Pew Research Center
In the last decade, Americans have increasingly supported the legalization of same-sex marriage. In 2007, Americans opposed legalizing same-sex marriage 54%, while 37% supported it. By 2017, the numbers flipped to 32% opposed and 62% supporting it. A Gallup survey found that 10% of LGBT Americans were married in 2017. Now, 61% of all same-sex couples living together are married.
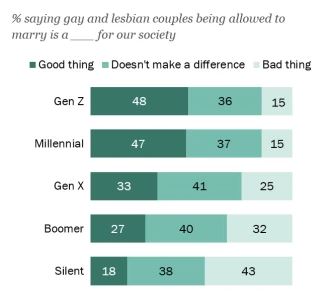
In a 2019 Pew Research Center report, nearly half of Gen Z and Millennials (respectively 48% and 47%) say same-sex marriage is good for society, while Gen Xers (33%), Boomers (27%) and Silent Gens (18%) say the same thing.
Source: Pew Research Center
Marriage and Divorce Rates Fall
The U.S. marriage rate declined from 8.2 marriages per 1,000 people in 2000 to 6.9 marriages in 2017 a nearly 15.9% decline. Something to note is the steep drop in the marriage rate from 2008 to 2009, corresponding to the start of the Great Recession. Home price bubbles burst and the housing crisis shifted into higher gears to set off the recession, people simply decided that it was better to put off getting married. The divorce rate has also declined during the same period, from 4 divorces per 1,000 people (48.78% of the marriage rate) in 2000 to 2.9 in 2017 (42.02% of the marriage rate). Divorces declined 27.5% from 2000-2017, nearly double the marriage percentage decline during the same period.
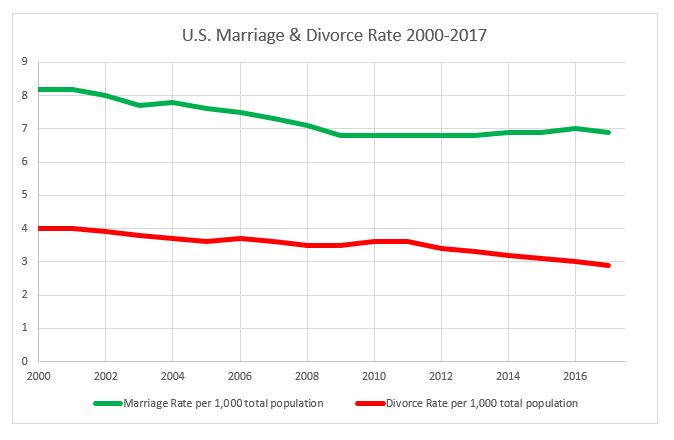
Marriage and divorce rates are falling as another relationship dynamic is rising.
Cohabitation
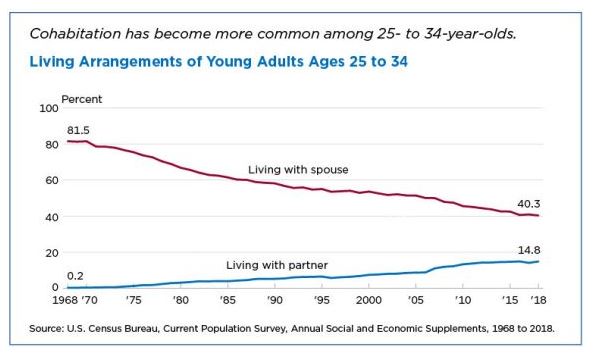
In 2016, 18 million Americans were living with an unmarried partner, this is an increase of 29% in less than a decade. About half cohabiters are younger than 35, but cohabitation is finding more fans in the age 50 and older category. This age group is cohabitating more quickly than other groups (75% jump).
Living Arrangements of Adults Ages 18-24
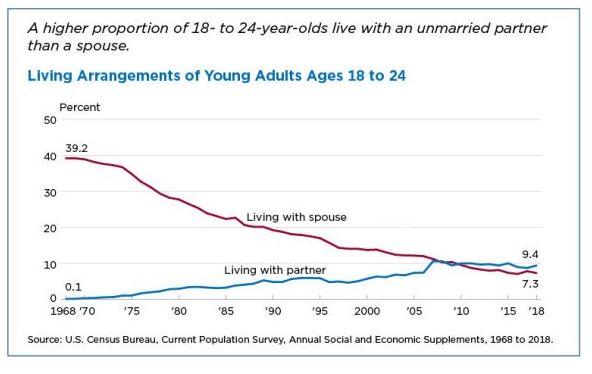
Living Arrangements of Adults Ages 25-34
Who are Cohabitating?
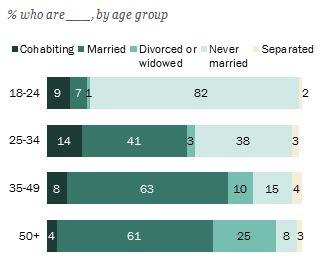
Credit: Pew Research Center
According to a 2019 Pew Research Center, cohabitation is more favorable among Gen Zers, Millennials, Gen Xers and Boomers, where large majorities of these members don’t feel that living together without being married doesn’t make a difference in our society. Even 54% of the Silent Gen is down with cohabitation, but 41% of the members in this generation say cohabitation is a bad thing.
Cohabitation has been considered bad for a successful marriage since the 1970s. Researchers found on average that couples who cohabitated before they married saw a 33% higher divorce rate than those couples who did not cohabitate before marriage. This may be due to a couple not thinking too deeply about making a conscious decision to share an entire life together. In other words, it was more convenient to ‘slide into’ marriage than to break off the relationship. When ‘real-life’ hits, the seriousness of ‘till death do us part’ is secondary as the couple may have looked at marriage not too different from getting a dog or buying a car together.
Religion, Political Affiliation and Marriage
There are large minorities of married couples that do not share the same religious belief. Among Americans who have been married since 2010, 39% have a spouse in a different religious group. This is 20 percentage points higher than those who wed before 1960. Most of these unions are between a Christian and a religiously unaffiliated spouse.
Politics divide more than religion. A 2016 Pew Research Center survey found that 77% of both Democrats and Republicans who were married, or cohabitating said their spouse or partner was in the same political party.
The takeaways are:
- Most people marry for love, lifelong commitment, and companionship, while the other traditional reasons for marriage: having their relationship recognized in a religious ceremony, financial stability and legal rights and benefits are way down on the list of why couples get married.
- Attitudes among Gen Z, Millennials are generally more positive towards interracial marriage, while it is less favorable among Gen Xers and older.
- Attitudes about the legalization of same-sex marriage have flipped towards more acceptance between 2007 and 2017.
- People are more aligned by political party affiliation than religion and choose their significant others based on this.
- Divorce attorneys might be getting a little worried about the number of people choosing to get married (and subsequently those getting a divorce).
- We are increasingly becoming a product and service subscription-based society where long-term commitment is not a guarantee as much. Marriage from the beginning was predicated on ownership. The wife was literally obtained as part of a trade: land, livestock, favorable business relationships with the family.
- Younger generations eschew ownership and long commitment. This might have affected the way they look at marriage. Opting to choose relationships and living arrangements that do not have the ‘ownership’ and ‘forever commitment’ constraints. We can call this the Spotifyzation of relationships.
Sources:
8 facts about love and marriage in America
Led by Baby Boomers, divorce rates climb for America’s 50+ population
When To Walk Away From Sexless Marriage (Truth Revealed)
History of Marriage:13 Surprising Facts
Marriage and divorce: patterns by gender, race, and educational attainment
The Science of Cohabitation: A Step Toward Marriage, Not a Rebellion
