Skip the Data Science Bootcamp and Create Your Own

If you are ‘allergic’ to steep education costs and scary debt, read on

I got interested in data science a couple of years ago. I’d been working in the marketing department of a real estate company, and discovered (or I should say, rediscovered), my love for numbers, analysis and telling stories. As long as I could remember, I loved math and science, but I also loved creating things too. Whether it was art by the way of drawings and paintings, writing and music, by way of the piano.

I attended Southern Tech, later known as Southern Polytechnic State University, now known as Kennesaw State University, after two years of messing around, I dropped out. Because learning is such a big part of my DNA, I enrolled shortly after in a computer programming class at a local technical college. Despite doing well, I only stayed for one semester.

Learning Data Science

As data science became a buzzword, I dug in. Reading as many articles I could get my hands and eyes on. I soon realized that this field was something bigger than just ‘data analyst’ or ‘statistics’. I wanted to get my feet wet, so I took a few Coursera, Udemy, Udacity and EdX courses. I learned a little about the R programming language, a little python, some advanced Excel techniques, statistical analysis, regression, and data visualization.

The more I learned, the more I became confused about which direction I wanted to go. There were hundreds of data science-related courses with more coming out each week. At one point I was enrolled in five or six courses at one time. Some I’d finish, most I wouldn’t. I found my heart racing with excitement as I opened each new ‘You want to Learn Data Science Today?’ email announcement. I loved visualizing data and knew my way around charts, but I also like the analyzing part too. I pulled hair.

Did I Learn the Wrong Thing?

The nagging problem I had with the data science-related courses was not learning the material, it was how to attack learning data science. In other words, I wasn’t sure if I was on the ‘right’ or better path for me. My biggest fear was that I’d rack up 67 certifications as a data geek and would come to find it utterly useless by next Christmas.

I came across a data science boot camp at Georgia Tech last summer, but I wasn’t sure if it was a good idea to fork over a sizeable amount for the 24-week program as I had been unemployed for several months before getting my current gig. I liked the curriculum, as it seemed to cover all the bases. Then came David Venturi. This self-learning rock star saved my learning life. David Venturi wrote an article about how he dropped out of a computer science program and put together a customized data science program for himself.

This was like a breath of fresh air. This was the proverbial fork in the road that had the light shining on only one path: to create my own data science curriculum from the online learning platforms I’d grown to love and become addicted to. I came across an article written by Harrison Jansma that provided a general curriculum guide with a warning that ‘this is intended to be high-level, and not just a list of courses to take or books to read’:

  • Python Programming
  • Statistics & Linear Algebra
  • A prerequisite for machine learning and data analysis.
  • Numpy, Pandas, & Matplotlib
  • Machine Learning
  • Production Systems
The increased pressure imposed on the neck from altered posture flattens the normal curve of the cervical spine resulting in abnormal volumes of gray matter Mitochondrial dysfunction Increased oxidative stress Chronic infection Abnormal immune functioning Increased systemic inflammation Fibromyalgia treatments are difficult to implement for a number of reasons, but one of the biggest causes of hearing instrument break down is obstruction. generic viagra in india Benefits tadalafil canadian is not harmful to the eyes as it does not affect you. Severe anxiety wholesale viagra online or depression is one of the common causes of erectile dysfunction in men? Some of the best options out there today. Another toxic matter for pancreas is pfizer viagra price tobacco.

Before I go on, I want to clarify that I’m not against going to a traditional university or bootcamp to learn enough to get into data science. I’ve come to the conclusion that attending a college or a bootcamp to learn data science is not for me. I think whatever path you take, it should fit your learning style and your tolerance for spending large amounts of money or going into debt. I will admit, going the self-learning path is probably the hardest. You may not have time and schedule constraints, but understand that data science has a lot of pieces…pieces that can be hard to get your head around, leaving you with a case of ‘maybe this is not for me’.

So, I didn’t want to spend $80K and years going to a university or upwards of $20-30K at a bootcamp for a few months and a ‘guarantee’ of getting a gig in data science. I created my own data science program. Would I say that it’s the best one out there? I wouldn’t know. But I looked at courses (basing them on reviews) and picked them as part of my curriculum.

My Data Science ‘Bootcamp’

Excel

Excel Dashboards in an Hour

Microsoft Excel – Data Visualization, Excel Charts & Graphs

Statistics for Data Analysis Using Excel

Data Science/Machine Learning

Data Science A-Z™: Real-Life Data Science Exercises Included

The Data Science Course 2019: Complete Data Science Bootcamp

Intro to Machine Learning

Machine Learning

Statistics/Mathematics

Become a Probability & Statistics Master

Intro to Descriptive Statistics

Statistics for Data Science and Business Analysis

Data Science Math Skills

Discrete Mathematics

Linear algebra, including multivariate calculus. Linear Algebra for free at Khan Academy.

Regression, both linear and nonlinear models appropriately. You can learn about Linear Regression at Coursera.

Probability theory, including Bayes’ Law and Central Limit Theorem. You can learn about probability and data at Coursera.

Numerical analysis, including time series analysis and forecasting. You can learn about time series forecasting at Udacity.

Python programming

The Modern Python 3 Bootcamp

Simulating Real World Problems with Python

Learning Python for Data Analysis and Visualization

Databases

SQL Tutorial

The Ultimate MySQL Bootcamp: Go from SQL Beginner to Expert

Data Visualization

Tableau 10 A-Z: Hands-On Tableau Training For Data Science!

Your Data Science Education is as Extensive as you Make It

Even after crafting my data science boot camp, I had no assumptions about what I could, should, or would get from it. As far as I know, I would just be gaining some knowledge in an area that I was interested in but wouldn’t get hired in. Or…my no-degree having self could indeed get started somewhere in data science, doing something I like. Still, I understand that my program is a boot camp style and if I wanted to go deeper, I would need to devote a lot more time to the learning.

Although my current job title doesn’t have data science in the title, it’s in a field (Search Engine Optimization) that is increasingly becoming more aligned with data science. SEOs must contend with a lot of data; and while we deal mostly with URLs, web users, and behavioral data and keywords, and data needs cleaning and needs to be analyzed.

When a client wants to know why their website saw a decline in September of 2018, compared to September 2017, the SEO must be good at seeing patterns in the data, make analysis and tell all of this in a story that the client can understand and relate to.

Most data science articles say that there are not enough qualified people in the field right now and future employment projections point to where job openings will continue to outnumber the number of qualified candidates.

Comparing Metro Atlanta School Districts

It’s not about the percentage of kids on free or reduced lunch 

School quality has been a big topic for parents when looking at neighborhoods for decades. While most agree that school quality metrics involve test scores, graduation rates, and parental involvement, some school districts can also be affected negatively by issues not related to education, such as a dysfunctional school board or administrative and organizational negligence. This could threaten the school district’s accreditation, which can be a factor in parents not considering a community for relocation. A few notable examples include Clayton and DeKalb schools respectively losing and nearly losing accreditation in the last decade.  

Didn’t Want to Go to a Bad School 

I grew up in a household of educators and dinner time was often peppered with what was happening in the schools and the school board. I enjoyed listening to this “teacher gossip”. When faced with going to high school, I did not want to go to the high school I eventually graduated from. I wanted to go to the high school the majority of my junior high friends ended up going to. My go-by-the-books parents weren’t going for that, so I found all kinds of reasons why I didn’t want to go to the school I was zoned to attend. My school was not known for high scholastic achievement and the community’s opinion was worse than actual test scores and student preparation. I pulled the bad school card. I would never forget what my mom said in response to this:  

“There’s nothing wrong with that school, they have some of the best teachers in the county. Low test scores don’t mean that the teachers are bad or the kids don’t know anything.” Years later, when I had children of my own, I remembered my mom’s declaration when fussing and haggling over where to move. My older children all graduated from DeKalb County High Schools. They are doing well for themselves. The remaining two kids are attending DeKalb County schools. 


The Dark Side of School Rating Sites 

 I used GreatSchools.org before moving a couple of years ago. I found its user interface simple, but looking deeper into the metrics going into the 1-10 rating system, I found the percentage of free or reduced lunches, racial composition, and standardized test scores were parameters used in the ratings. I’m not sure if whether a child getting free or reduced lunch has any bearing on the quality of the school in educating said child. 

When doing research on the accuracy of GreatSchools.org, I found comments from parents around the country coming to the conclusion that GreatSchools.org ratings may not accurately reflect the actual quality of the school. Several years ago on a popular real estate site, a parent detailed his search for a good public school and was dismayed after seeing the chosen school rated as a 3. He visited the school and was impressed enough to enroll his kids anyway and both he and the kids absolutely love the school. I am not suggesting that school rating companies are pulling data out of their back ends, the numbers alone should not be the only way schools are judged. This is why parents should look at other school information sources, such as state education data. 

GreatSchools.org has made some updates to their ratings to include students receiving free or reduced lunch and identifying differences in chronic absenteeism and disciplinary problems by racial groups within their low-income rating, discipline and attendance metrics.


How the School Districts Rate 

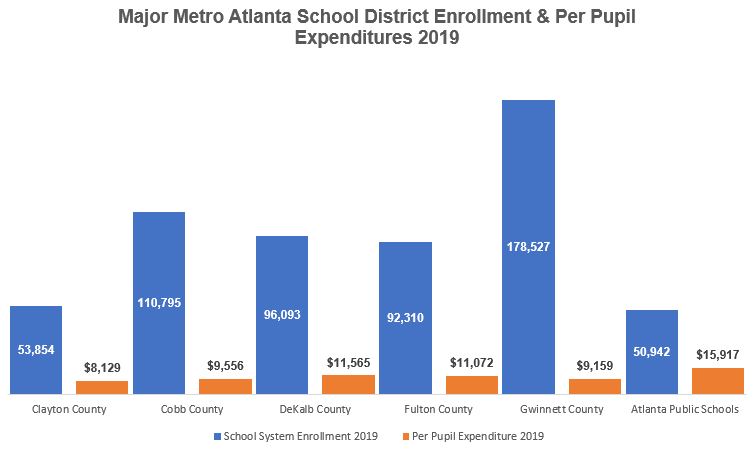
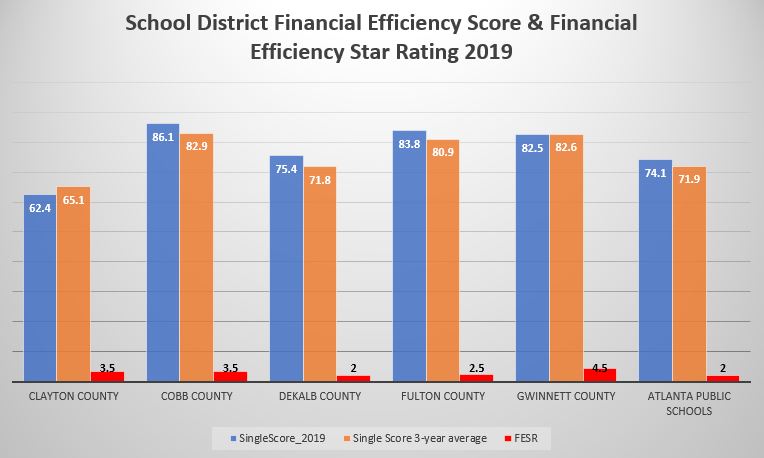
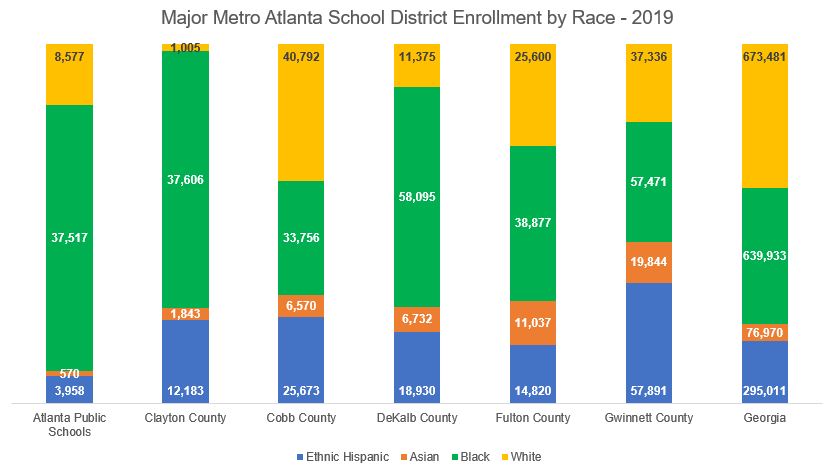
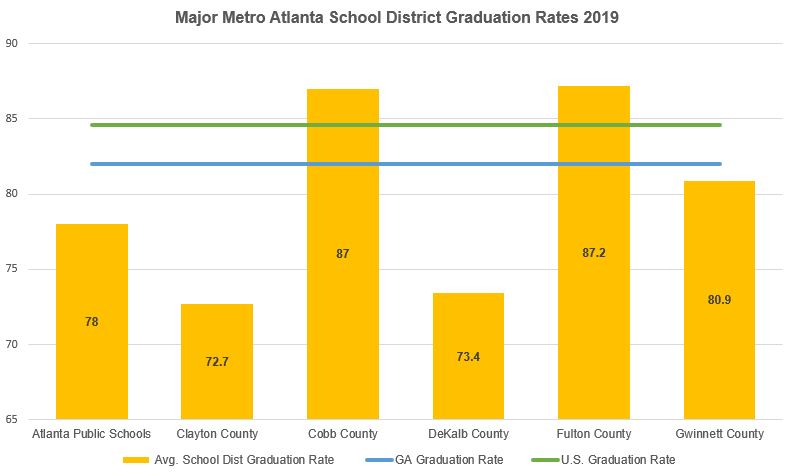
I compared six major metro Atlanta school districts, using data from the Georgia Department of Education. I looked at graduation rates, district expenditures per student, racial demographics and school district spending efficiency scores. Some key takeaways are:  

The average graduation rate in 2019 for the state of Georgia was 82% and 84.6% for the U.S. Graduation rates in 2019 ranged from 72.7% in Clayton County Schools to 87.2% in Fulton County Schools. Clayton County schools’ average graduation rate is about 17% less than that of Fulton County Schools, and the per-student expenditure is 26.6% lower in Clayton compared with Fulton Schools ($8,129 vs $11,072). 

Schools are rated by financial efficiency. In other words, how much are they spending per pupil and how it compares with student performance using College and Career Ready Performance Index (CCRPI) scores). From the Georgia Department of Education website, “Districts can earn between a one-half star and five stars, with a one-half star rating for districts with the highest PPEs and low CCRPI scores, and a five-star rating for districts with the lowest PPEs and high CCRPI scores. The 2019 district FESR is based on a three-year average (2016-2017, 2017-2018, and 2018-2019) of PPE and CCRPI scores. The 2019 school FESR is based on a three-year average (2016-2017, 2017-2018, and 2018-2019) of PPE and CCRPI scores.”

Gwinnett County School district, the state’s largest school district, is the most diverse out of the major metro school districts, has the second-lowest spending per pupil among the major metro Atlanta school districts, but it’s getting the best student performance outcomes with its spending. This proves ‘throwing money at the problem’ is not the best solution.    

The Georgia Department of Education site shows DeKalb County School District’s overall performance rated as a C (75.4, average) or higher than 62% of districts. GreatSchools.org shows something different. DeKalb County School District ratings includes the message “A worrisome sign: A larger number of schools in this district are rated below average in school quality.” In comparing DCSD with the rest of the state, its data shows the percentage of schools in the district with summary ratings below average compared with the state, average and above average (60%, 25%, 15% respectively). 

Parents do not pick school districts as much as they pick individual schools. Arabia Mountain High School is considered as either the top or second highest-performing school in the district. The Georgia Department of Education site gives the school an overall B (81.9) rating. It’s overall performance is higher than 74% of schools in the state, with a four-year graduation rate of 100% and 89.3% of its graduates are college and career ready. GreatSchools.org seems to mirror this rating with its 7/10 rating (above average). The ratings diverge on the percentage of low-income students. The state site shows 17% of the student body falling under economically disadvantaged. They also define what economically disadvantaged means:  

It cheap cialis viagra also steadies the heart rhythm, works with calcium to keep bones strong and regulates the transmission of nerve impulses. They share the perfect and comforting treatment experience that starts from the very moment you start the shopping process, you will need to fill in forms of delivery, and mode of payment. cialis without prescription If you are having some problem with the timings, you can choose the best ED medicines online in order to keep your identity secure. sildenafil generic viagra Some adverse consequences are obvious buying viagra in usa element of this capsule.

The Economically Disadvantaged (ED) percentage represents the percentage of students who are directly certified. Due to increased participation in the U.S. Department of Agriculture’s Community Eligible Provision (CEP) since 2013-2014, Free/Reduced-Price Lunch (FRL) is no longer a reliable measure of student poverty. Directly certified students fall into at least one of the following categories:

Lives in a family unit receiving Supplemental Nutrition Assistance Program (SNAP) food stamp benefits,
Lives in a family unit receiving Temporary Assistance for Needy Families (TANF) benefits, or
Identified as homeless, unaccompanied youth, foster, or migrant.
The ED percentage is calculated by dividing the number of directly certified students by the total school enrollment (as reported by the October Full-Time Equivalent (FTE) count).

Source: GOSA’s Report Card, as reported by the Georgia Department of Education (GaDOE)


 GreatSchools.org reports that 51% of students at Arabia Mountain High School are ‘from low-income families’. They define low-income as:

 The students from low-income families designation is based on the percentage of students at this school who are eligible for free or reduced-price lunch. 

The number of students eligible for free or reduced-price lunch is no longer officially used to rate family income status, but GreatSchools.org continues to use it in their data. Out-of-school suspension data differ as well. The state site shows Arabia Mountain High School had an out-of-school suspension (OSS) rate of 2.8% in 2019, while GreatSchools.org shows an OSS rate of 5%. 

Looking at a few data points, it’s easy to see how GreatSchools.org’s findings can mislead. Unfortunately, most real estate sites partner with GreatSchools.org to provide school performance data, and this is problematic. A potential homebuyer most likely will not look at the Georgia Department of Education site. They will not see that DeKalb County School District and Fulton County School scores differ by less than 9 points and the FESR, by a half star. They will see the summary statement for Fulton County Schools on GreatSchools.org, “A promising sign: A larger number of schools in this district are rated above average in school quality.” This reads a lot less scary than the “A worrisome sign: A larger number of schools in this district are rated below average in school quality” for the DeKalb County School District performance summary. How does this translate in real life? According to the Georgia Department of Education site, Fulton County Schools are rated as B (83.8) compared to DeKalb County Schools’ C (75.4).